Coastal Smart Growth Home: Getting Started: Report Cards
REPORT CARDS
Report cards and illustrative maps communicate relevant information in a manner that can easily be understood by stakeholders. Report cards help organize information about progress towards accomplishing defined goals, and illustrative maps can depict physical features, community makeup or vision, and other characteristics that are connected to the community.
How to Get Started
Water Quality Scorecard

EPA's Smart Growth Program, in conjunction with the Office of Water, has released Water Quality Scorecard: Incorporating Green Infrastructure Practices at the Municipal, Neighborhood, and Site Scale. This scorecard offers policy options for protecting and improving water quality across different scales of land use and across multiple municipal departments.
The Vermont Smart Growth Scorecard
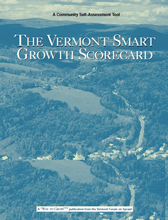
This guide by Smart Growth Vermont provides a simple means of assessing how well a community is preparing for growth and achieving goals in their community’s vision.
Ecosystem Health Report Cards
These report cards compiled by the University of Maryland Center for Environmental Science, and NOAA’s National Centers for Coastal Ocean Science, are assessments and communication tools that compare environmental data with management choices. There are multiple examples available, such as the Chesapeake Bay and Maryland Coastal Bays. Each report card includes grades and condition details.
